One-way analysis of variance (ANOVA)
2021-03-22
Defination of ANOVA
Analysis of variance (ANOVA) is an analysis tool used in statistics that splits an observed aggregate variability found inside a data set into two parts: systematic factors and random factors. The systematic factors have a statistical influence on the given data set, while the random factors do not. Analysts use the ANOVA test to determine the influence that independent variables have on the dependent variable in a regression study– cited from WILL KENTON(https://www.investopedia.com/terms/a/anova.asp)
Load data
library(multcomp)
library(dplyr)
setwd("C:/blog/Dataset")
data <- read.csv("fruits_Vc.csv")
head(data)
## Number Fruit Repeat Vitamin
## 1 1 Apple A1 4.6
## 2 2 Apple A2 3.9
## 3 3 Apple A3 5.2
## 4 4 Apple A4 6.9
## 5 5 Apple A5 4.8
## 6 6 Apple A6 3.3To compare the vitamin C contents of different fruits
data$Fruit = as.factor(data$Fruit)
VitaminC <- data$Vitamin
Fruits <- data$Fruit

aggregate(VitaminC, by =list(Fruits), FUN=mean)
## Group.1 x
## 1 Apple 4.783333
## 2 Banana 10.266667
## 3 Watermelon 8.683333aggregate(VitaminC, by =list(Fruits), FUN=sd)## Group.1 x
## 1 Apple 1.2384130
## 2 Banana 1.5807171
## 3 Watermelon 0.9847165fit <- aov(VitaminC ~ Fruits)
summary(fit)## Df Sum Sq Mean Sq F value Pr(>F)
## Fruits 2 95.57 47.78 28.66 7.52e-06 ***
## Residuals 15 25.01 1.67
## ---
## Signif. codes: 0 '***' 0.001 '**' 0.01 '*' 0.05 '.' 0.1 ' ' 1TukeyHSD(fit)## Tukey multiple comparisons of means
## 95% family-wise confidence level
##
## Fit: aov(formula = VitaminC ~ Fruits)
##
## $Fruits
## diff lwr upr p adj
## Banana-Apple 5.483333 3.546906 7.4197605 0.0000068
## Watermelon-Apple 3.900000 1.963573 5.8364272 0.0002819
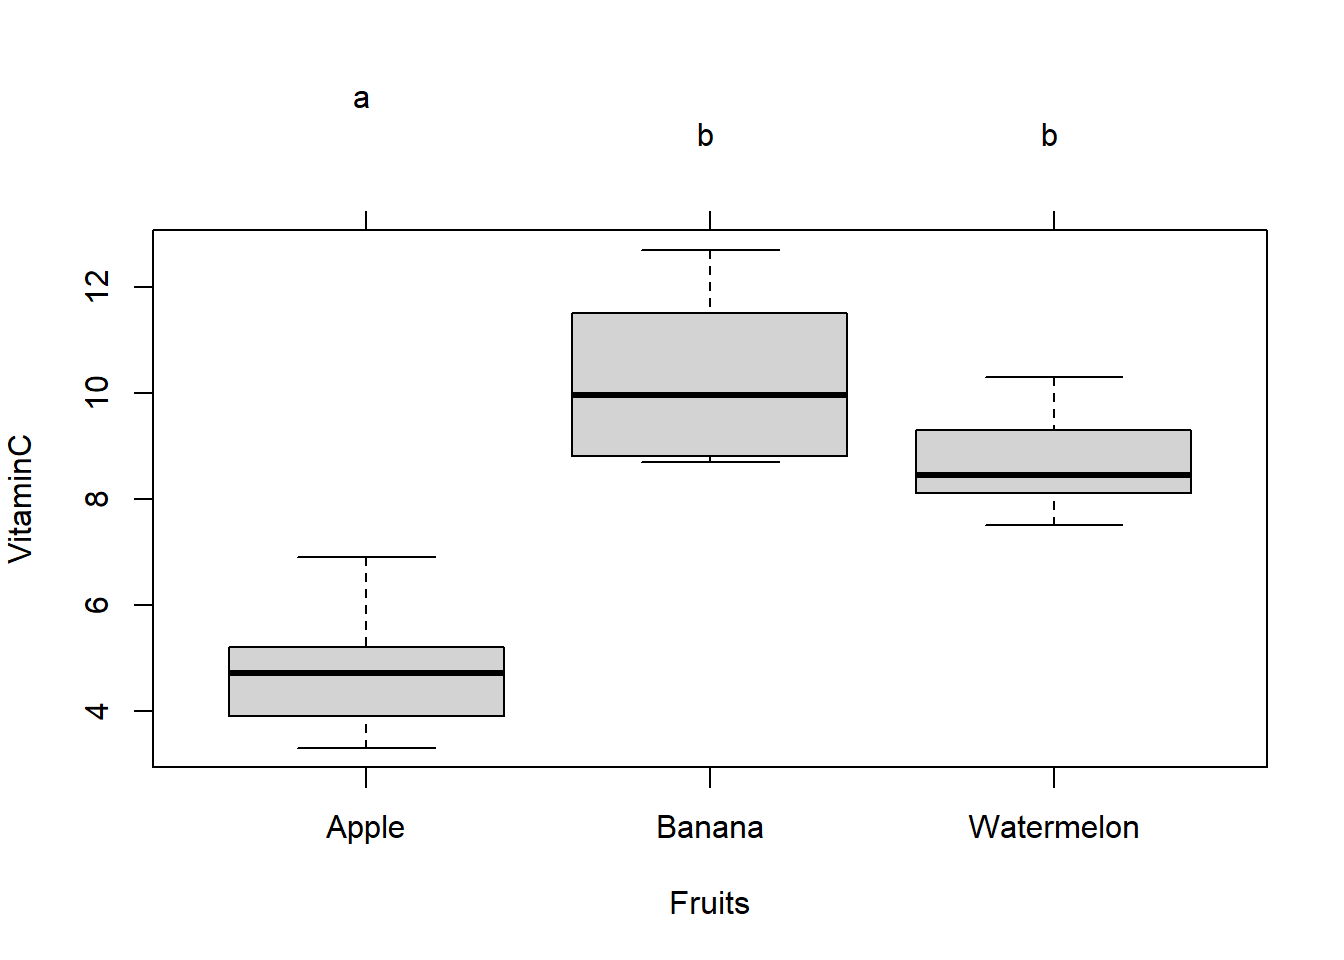
## Watermelon-Banana -1.583333 -3.519761 0.3530938 0.1184352par(mar=c(5,4,6,2))
data$Fruit = as.factor(data$Fruit)
tuk <- glht(fit,linfct= mcp(Fruits="Tukey"))
p1 <- plot(cld(tuk,level=.05),col="lightgrey")
To save the ANOVA results after calculations
table <- group_by(data, data$Fruit) %>%
  summarise(
    .groups = 'drop',
    count = n(),
    mean = mean(Vitamin, na.rm = TRUE),
    sd = sd(Vitamin, na.rm = TRUE)
  )

View(table)

print(table)
## # A tibble: 3 x 4
## `data$Fruit` count mean sd
## <fct> <int> <dbl> <dbl>
## 1 Apple 6 4.78 1.24
## 2 Banana 6 10.3 1.58
## 3 Watermelon 6 8.68 0.985