Discrimination model (PLS-DA)
2021-04-08
Discrimination analysis
Examples: Using PLS-DA for geographical origin of oils
Dataset: Mid-infrared spectroscopy of Extra Virgin Olive Oils for Geographical origin discrimination analysis (Quadram open dataset,2003).
Data preprocess
## Load date
setwd("C:/blog/Dataset")

oil <- read.csv('FTIR_Spectra_olive_oils.csv',header = F,
                stringsAsFactors = T)

print(oil[1:10,1:5])
## V1 V2 V3 V4 V5
## 1 Sample Number: 1 1 2 2
## 2 Group Code: 1 1 1 1
## 3 Wavenumbers Greece Greece Greece Greece
## 4 798.892 0.127523009 0.126498181 0.130411785 0.130022227
## 5 800.8215 0.127949615 0.127130974 0.130675401 0.130406662
## 6 802.751 0.129282219 0.128510777 0.13201661 0.132018029
## 7 804.6805 0.131174169 0.13033991 0.133824061 0.134007275
## 8 806.61 0.133590328 0.132527221 0.136095296 0.136270568
## 9 808.5395 0.136425525 0.135308508 0.138943757 0.13887477
## 10 810.469 0.139357827 0.13835292 0.141722779 0.141481132## data transpose
oil_transpose <- as.data.frame(t(oil))
print(oil_transpose[1:10,1:5])## V1 V2 V3 V4 V5
## V1 Sample Number: Group Code: Wavenumbers 798.892 800.8215
## V2 1 1 Greece 0.127523009 0.127949615
## V3 1 1 Greece 0.126498181 0.127130974
## V4 2 1 Greece 0.130411785 0.130675401
## V5 2 1 Greece 0.130022227 0.130406662
## V6 3 1 Greece 0.128601989 0.128789565
## V7 3 1 Greece 0.128217254 0.128282253
## V8 4 1 Greece 0.126174933 0.126732773
## V9 4 1 Greece 0.126466053 0.126915413
## V10 5 1 Greece 0.127060105 0.127551128## rename some col names to make data analysis easier
colnames(oil_transpose)=oil_transpose[1,]
oil_transpose <- oil_transpose[-1,]
library(dplyr)
oil_transpose <- rename(oil_transpose,c("Group" ="Group Code:",
"Number" ="Sample Number:",
"Countries" ="Wavenumbers"))
## Get transposed dataset
oil.data <- oil_transpose
print(oil.data[1:10,1:5])## Number Group Countries 798.892 800.8215
## V2 1 1 Greece 0.127523009 0.127949615
## V3 1 1 Greece 0.126498181 0.127130974
## V4 2 1 Greece 0.130411785 0.130675401
## V5 2 1 Greece 0.130022227 0.130406662
## V6 3 1 Greece 0.128601989 0.128789565
## V7 3 1 Greece 0.128217254 0.128282253
## V8 4 1 Greece 0.126174933 0.126732773
## V9 4 1 Greece 0.126466053 0.126915413
## V10 5 1 Greece 0.127060105 0.127551128
## V11 5 1 Greece 0.126812707 0.127460743df_raw <- oil.data[,4:573]
df <- as.data.frame(apply(df_raw, 2, as.numeric))
str(df)## 'data.frame': 120 obs. of 570 variables:
## $ 798.892 : num 0.128 0.126 0.13 0.13 0.129 ...
## $ 800.8215 : num 0.128 0.127 0.131 0.13 0.129 ...
## $ 802.751 : num 0.129 0.129 0.132 0.132 0.13 ...
## $ 804.6805 : num 0.131 0.13 0.134 0.134 0.132 ...
## $ 806.61 : num 0.134 0.133 0.136 0.136 0.134 ...
## $ 808.5395 : num 0.136 0.135 0.139 0.139 0.137 ...
## $ 810.469 : num 0.139 0.138 0.142 0.141 0.14 ...
## $ 812.3985 : num 0.142 0.141 0.144 0.144 0.142 ...
## $ 814.328 : num 0.145 0.144 0.146 0.147 0.145 ...
## $ 816.2575 : num 0.147 0.146 0.148 0.148 0.147 ...
## $ 818.187 : num 0.148 0.147 0.15 0.15 0.149 ...
## $ 820.1165 : num 0.15 0.149 0.152 0.152 0.15 ...
## $ 822.046 : num 0.152 0.151 0.154 0.154 0.153 ...
## $ 823.9755 : num 0.155 0.154 0.157 0.157 0.155 ...
## $ 825.905 : num 0.158 0.157 0.159 0.159 0.158 ...
## $ 827.8345 : num 0.161 0.16 0.163 0.162 0.161 ...
## $ 829.764 : num 0.164 0.163 0.166 0.166 0.164 ...
## $ 831.6935 : num 0.167 0.166 0.169 0.169 0.167 ...
## $ 833.623 : num 0.171 0.169 0.172 0.172 0.17 ...
## $ 835.5525 : num 0.174 0.173 0.176 0.176 0.174 ...
## $ 837.482 : num 0.178 0.177 0.179 0.179 0.177 ...
## $ 839.4115 : num 0.182 0.181 0.184 0.184 0.182 ...
## $ 841.341 : num 0.187 0.186 0.189 0.189 0.186 ...
## $ 843.2705 : num 0.192 0.191 0.194 0.194 0.192 ...
## $ 845.2 : num 0.197 0.196 0.199 0.198 0.197 ...
## $ 847.1295 : num 0.201 0.201 0.203 0.203 0.201 ...
## $ 849.059 : num 0.205 0.204 0.207 0.207 0.205 ...
## $ 850.9885 : num 0.208 0.207 0.209 0.209 0.208 ...
## $ 852.918 : num 0.21 0.209 0.211 0.211 0.209 ...
## $ 854.8475 : num 0.21 0.21 0.212 0.212 0.21 ...
## $ 856.777 : num 0.21 0.209 0.212 0.211 0.21 ...
## $ 858.7065 : num 0.209 0.208 0.211 0.21 0.209 ...
## $ 860.636 : num 0.209 0.207 0.21 0.21 0.209 ...
## $ 862.5655 : num 0.209 0.208 0.209 0.209 0.208 ...
## $ 864.495 : num 0.209 0.209 0.21 0.21 0.209 ...
## $ 866.4245 : num 0.21 0.21 0.211 0.211 0.21 ...
## $ 868.354 : num 0.211 0.21 0.211 0.212 0.211 ...
## $ 870.2835 : num 0.211 0.21 0.212 0.212 0.211 ...
## $ 872.213 : num 0.211 0.21 0.211 0.212 0.211 ...
## $ 874.1425 : num 0.209 0.209 0.21 0.21 0.21 ...
## $ 876.072 : num 0.207 0.206 0.208 0.209 0.207 ...
## $ 878.0015 : num 0.205 0.204 0.206 0.206 0.205 ...
## $ 879.931 : num 0.202 0.202 0.203 0.203 0.202 ...
## $ 881.8605 : num 0.201 0.2 0.202 0.202 0.201 ...
## $ 883.79 : num 0.2 0.199 0.201 0.201 0.2 ...
## $ 885.7195 : num 0.2 0.199 0.201 0.201 0.2 ...
## $ 887.649 : num 0.2 0.2 0.201 0.201 0.201 ...
## $ 889.5785 : num 0.201 0.2 0.202 0.202 0.201 ...
## $ 891.508 : num 0.2 0.199 0.201 0.201 0.2 ...
## $ 893.4375 : num 0.199 0.198 0.2 0.199 0.199 ...
## $ 895.367 : num 0.197 0.196 0.198 0.198 0.197 ...
## $ 897.2965 : num 0.195 0.194 0.197 0.197 0.195 ...
## $ 899.226 : num 0.195 0.194 0.196 0.196 0.194 ...
## $ 901.1555 : num 0.195 0.193 0.196 0.195 0.194 ...
## $ 903.085 : num 0.195 0.194 0.196 0.196 0.194 ...
## $ 905.0145 : num 0.195 0.194 0.196 0.196 0.195 ...
## $ 906.944 : num 0.195 0.193 0.196 0.195 0.195 ...
## $ 908.8735 : num 0.194 0.193 0.195 0.195 0.194 ...
## $ 910.803 : num 0.193 0.192 0.194 0.194 0.193 ...
## $ 912.7325 : num 0.192 0.19 0.193 0.193 0.192 ...
## $ 914.662 : num 0.19 0.189 0.192 0.192 0.191 ...
## $ 916.5915 : num 0.189 0.188 0.191 0.191 0.189 ...
## $ 918.521 : num 0.188 0.186 0.189 0.189 0.188 ...
## $ 920.4505 : num 0.186 0.185 0.188 0.188 0.186 ...
## $ 922.38 : num 0.185 0.183 0.187 0.187 0.185 ...
## $ 924.3095 : num 0.184 0.183 0.186 0.186 0.184 ...
## $ 926.239 : num 0.184 0.182 0.186 0.186 0.184 ...
## $ 928.1685 : num 0.185 0.183 0.187 0.187 0.185 ...
## $ 930.098 : num 0.186 0.185 0.189 0.189 0.187 ...
## $ 932.0275 : num 0.19 0.189 0.192 0.192 0.191 ...
## $ 933.957 : num 0.195 0.194 0.197 0.197 0.195 ...
## $ 935.8865 : num 0.2 0.199 0.202 0.202 0.201 ...
## $ 937.816 : num 0.206 0.204 0.208 0.208 0.206 ...
## $ 939.7455 : num 0.211 0.21 0.213 0.213 0.212 ...
## $ 941.675 : num 0.217 0.216 0.219 0.219 0.217 ...
## $ 943.6045 : num 0.223 0.221 0.225 0.225 0.223 ...
## $ 945.534 : num 0.229 0.227 0.231 0.231 0.229 ...
## $ 947.4645 : num 0.234 0.233 0.236 0.237 0.235 ...
## $ 949.394 : num 0.24 0.238 0.242 0.242 0.24 ...
## $ 951.3235 : num 0.245 0.244 0.247 0.247 0.246 ...
## $ 953.253 : num 0.251 0.25 0.253 0.253 0.251 ...
## $ 955.1825 : num 0.257 0.256 0.259 0.259 0.257 ...
## $ 957.112 : num 0.263 0.262 0.264 0.265 0.263 ...
## $ 959.0415 : num 0.268 0.267 0.27 0.27 0.268 ...
## $ 960.971 : num 0.273 0.271 0.274 0.275 0.273 ...
## $ 962.9005 : num 0.276 0.275 0.278 0.278 0.276 ...
## $ 964.83 : num 0.278 0.276 0.28 0.28 0.277 ...
## $ 966.7595 : num 0.278 0.277 0.281 0.281 0.278 ...
## $ 968.689 : num 0.277 0.277 0.28 0.281 0.278 ...
## $ 970.6185 : num 0.276 0.275 0.278 0.279 0.276 ...
## $ 972.548 : num 0.274 0.273 0.276 0.276 0.274 ...
## $ 974.4775 : num 0.272 0.271 0.273 0.274 0.271 ...
## $ 976.407 : num 0.271 0.269 0.272 0.273 0.27 ...
## $ 978.3365 : num 0.271 0.269 0.272 0.273 0.271 ...
## $ 980.266 : num 0.273 0.271 0.273 0.274 0.272 ...
## $ 982.1955 : num 0.275 0.273 0.276 0.276 0.274 ...
## $ 984.125 : num 0.276 0.275 0.277 0.277 0.276 ...
## $ 986.0545 : num 0.277 0.276 0.278 0.278 0.277 ...
## $ 987.984 : num 0.278 0.277 0.279 0.279 0.278 ...
## [list output truncated]print(df[1:10,1:5])## 798.892 800.8215 802.751 804.6805 806.61
## 1 0.1275230 0.1279496 0.1292822 0.1311742 0.1335903
## 2 0.1264982 0.1271310 0.1285108 0.1303399 0.1325272
## 3 0.1304118 0.1306754 0.1320166 0.1338241 0.1360953
## 4 0.1300222 0.1304067 0.1320180 0.1340073 0.1362706
## 5 0.1286020 0.1287896 0.1300223 0.1320119 0.1344266
## 6 0.1282173 0.1282823 0.1296366 0.1317986 0.1340615
## 7 0.1261749 0.1267328 0.1282438 0.1298927 0.1317546
## 8 0.1264661 0.1269154 0.1282541 0.1299583 0.1320672
## 9 0.1270601 0.1275511 0.1289000 0.1306090 0.1329558
## 10 0.1268127 0.1274607 0.1287653 0.1306390 0.1331313## SNV transformation
library(prospectr)
df_snv <- standardNormalVariate(df)
oil.snv <- cbind(oil.data[,1:3], df)To have a pls-da plot
library(mixOmics)
## Data set

oil_data <- oil.snv[,4:573]
X <- oil_data

Country <- oil.snv[,3]
Y <- as.factor(Country)

summary(Y)
## Greece Italy Portugal Spain
## 20 34 16 50MyResult.splsda <- mixOmics::splsda(X,Y, keepX = c(10,15))
plotIndiv(MyResult.splsda, ind.names = FALSE, legend=TRUE,
ellipse = TRUE, star = TRUE, title = 'sPLS-DA on geographical origin of oil',
X.label = 'PLS-DA 1 (44%)', Y.label = 'PLS-DA 2 (20%)')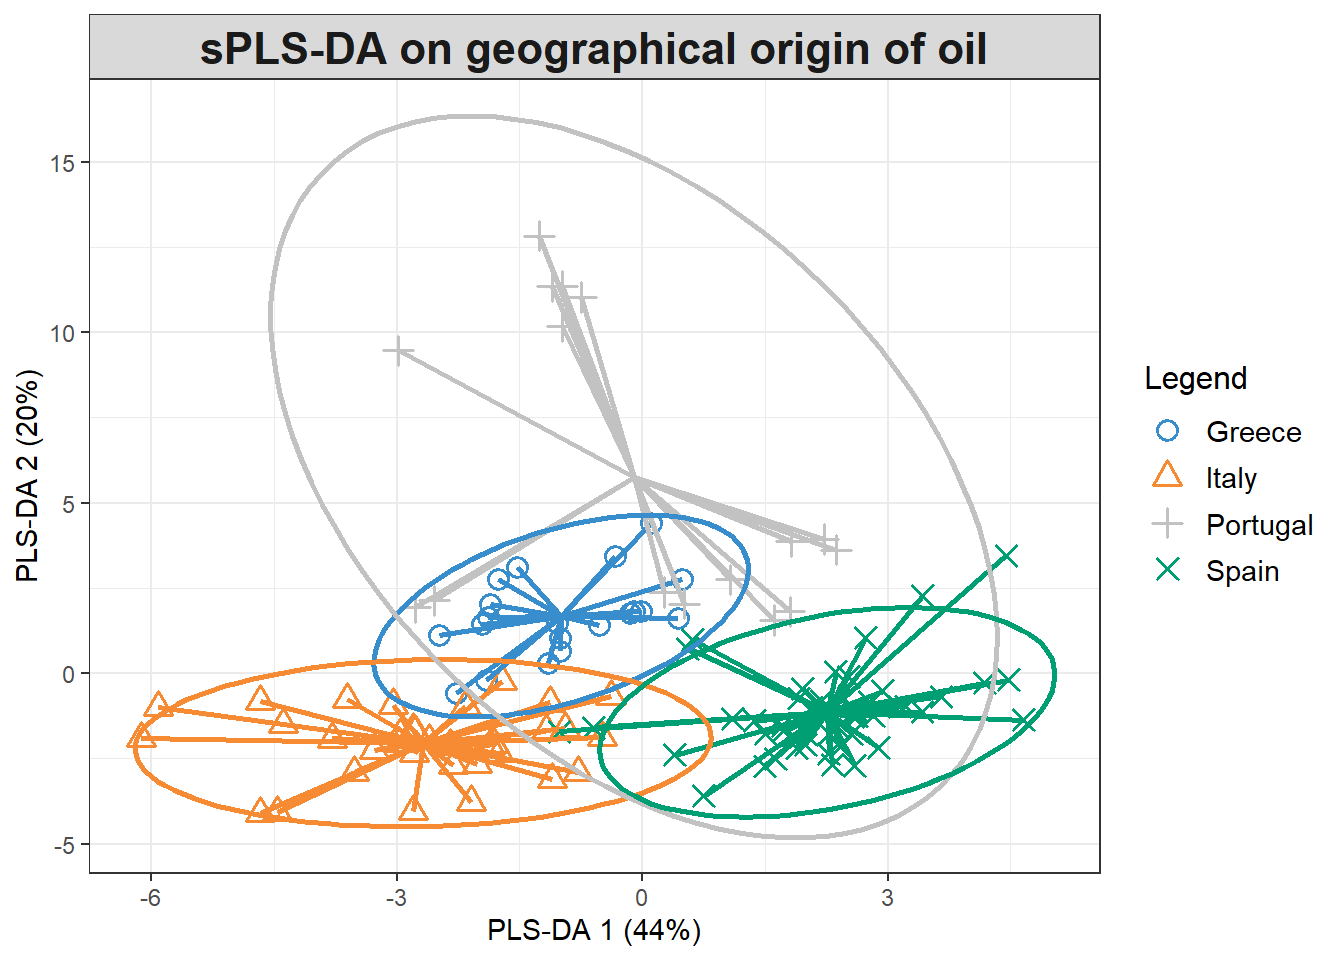
auc.plsda <- auroc(MyResult.splsda)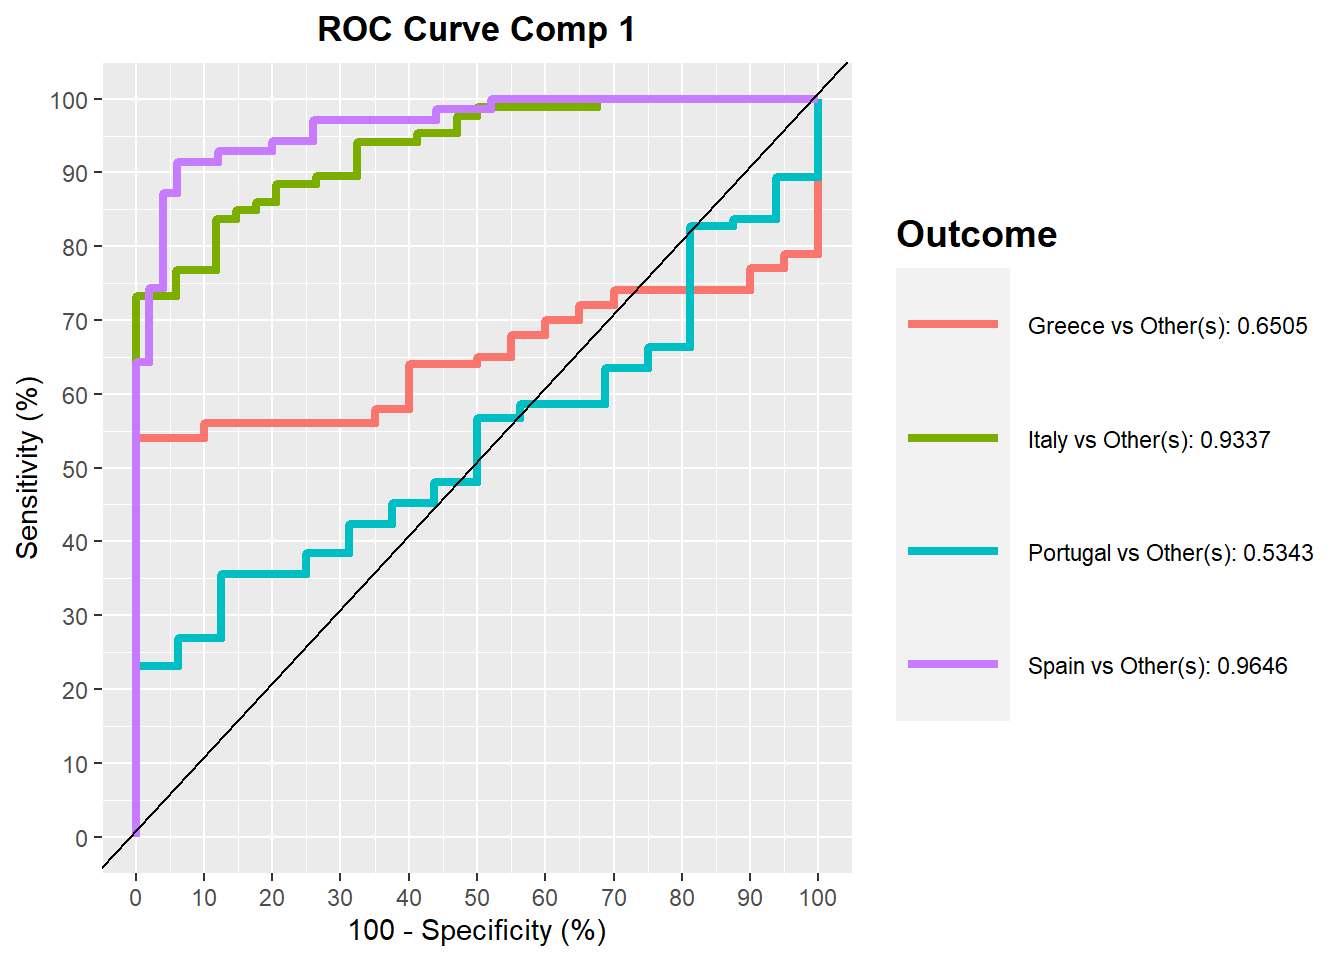
## $Comp1
##                         AUC   p-value
## Greece vs Other(s)   0.6505 3.404e-02
## Italy vs Other(s)    0.9337 1.528e-13
## Portugal vs Other(s) 0.5343 6.599e-01
## Spain vs Other(s)    0.9646 0.000e+00
##
## $Comp2
##                         AUC   p-value
## Greece vs Other(s)   0.8570 4.960e-07
## Italy vs Other(s)    0.9867 2.220e-16
## Portugal vs Other(s) 0.9633 2.646e-09
## Spain vs Other(s)    0.9891 0.000e+00
Variable selection outputs
The contribution of selected variables for PLS-DA model:
MyResult.splsda2 <- mixOmics::splsda(X,Y, ncomp=3, keepX=c(15,10,5))

plotLoadings(MyResult.splsda2, contrib = 'max', method = 'mean')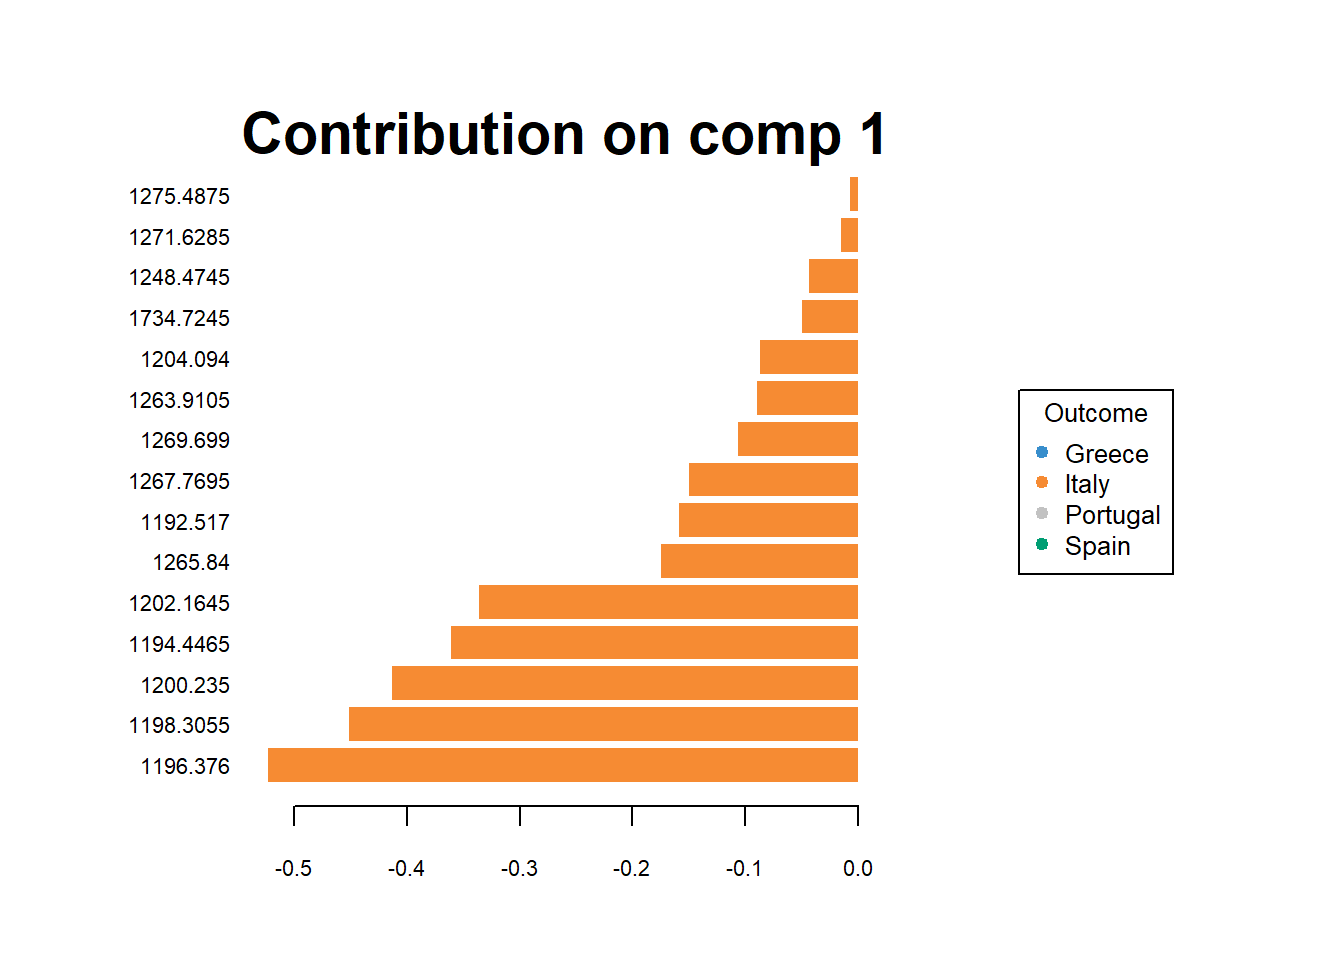
Tuning parameters and numerical outputs
MyResult.plsda2 <- mixOmics::splsda(X,Y, ncomp=10)
set.seed(30) # for reproducbility in this vignette, otherwise increase nrepeat
MyPerf.plsda <- perf(MyResult.plsda2, validation = "Mfold", folds = 3,
                  progressBar = FALSE, nrepeat = 10) # we suggest nrepeat = 50

plot(MyPerf.plsda, col = color.mixo(5:7), sd = TRUE, legend.position = "horizontal")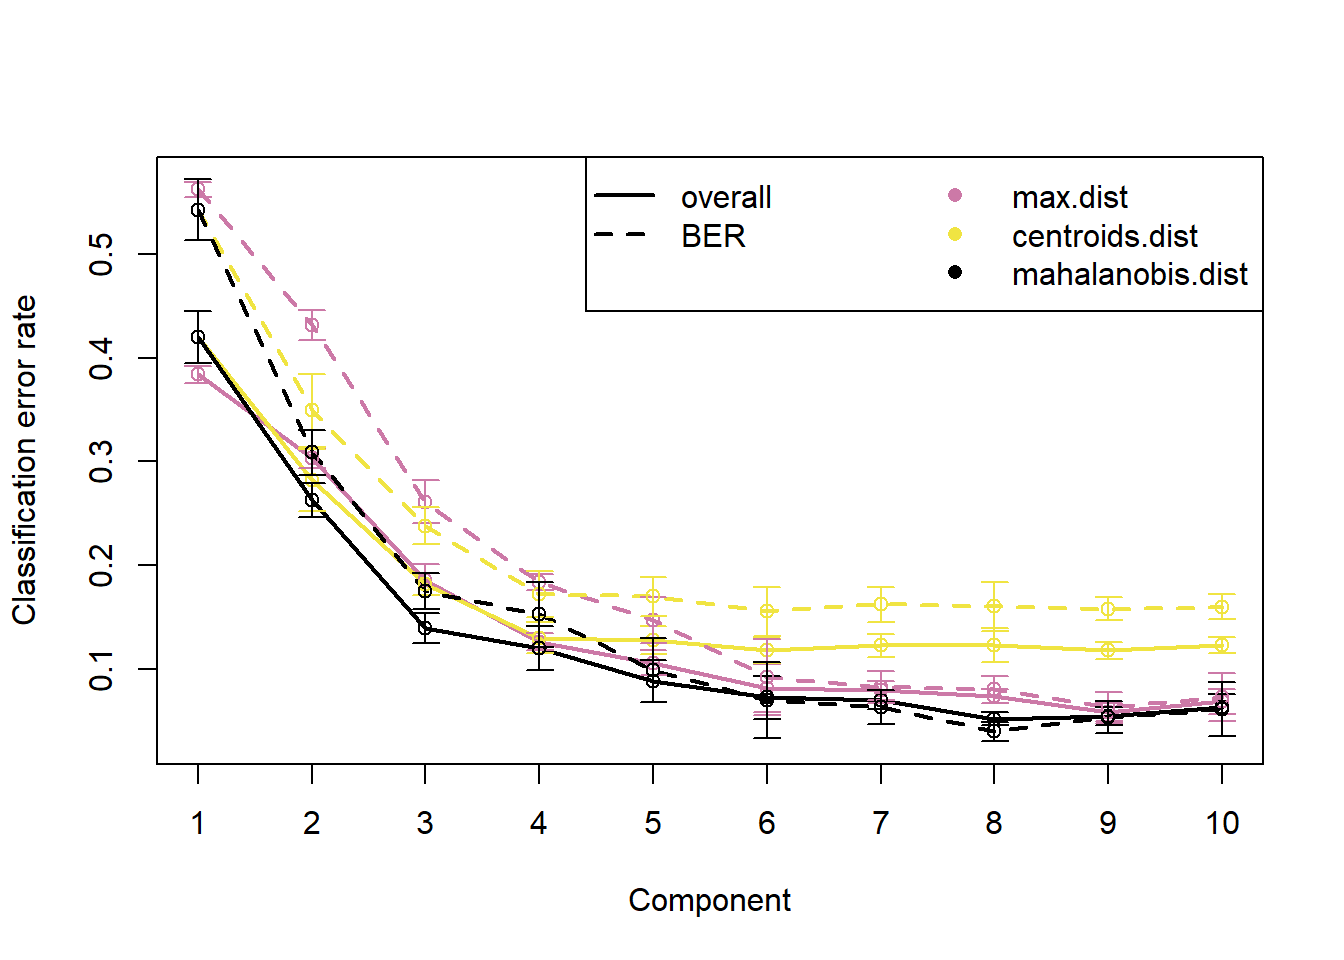
list.keepX <- c(5:10,  seq(20, 100, 10))

list.keepX
## [1] 5 6 7 8 9 10 20 30 40 50 60 70 80 90 100set.seed(123)
tune.splsda.oil <- tune.splsda(X, Y, ncomp = 10,
validation = 'Mfold',
folds = 3, dist = 'max.dist', progressBar = FALSE,
measure = "BER", test.keepX = list.keepX,
nrepeat = 50)
error <- tune.splsda.oil$error.rate
ncomp <- tune.splsda.oil$choice.ncomp$ncomp
ncomp## [1] 7select.keepX <- tune.splsda.oil$choice.keepX[1:ncomp]
select.keepX## comp1 comp2 comp3 comp4 comp5 comp6 comp7
## 7 5 50 10 5 80 40The final pls-da model using tuning setting
MyResult.splsda.final <- mixOmics::splsda(X, Y, ncomp = ncomp, keepX = select.keepX)

plotIndiv(MyResult.splsda.final, ind.names = FALSE, legend=TRUE,
          ellipse = TRUE, star = TRUE, title = 'sPLS-DA on geographical origin of oil',
          X.label = 'PLS-DA 1 (30%)', Y.label = 'PLS-DA 2 (16%)')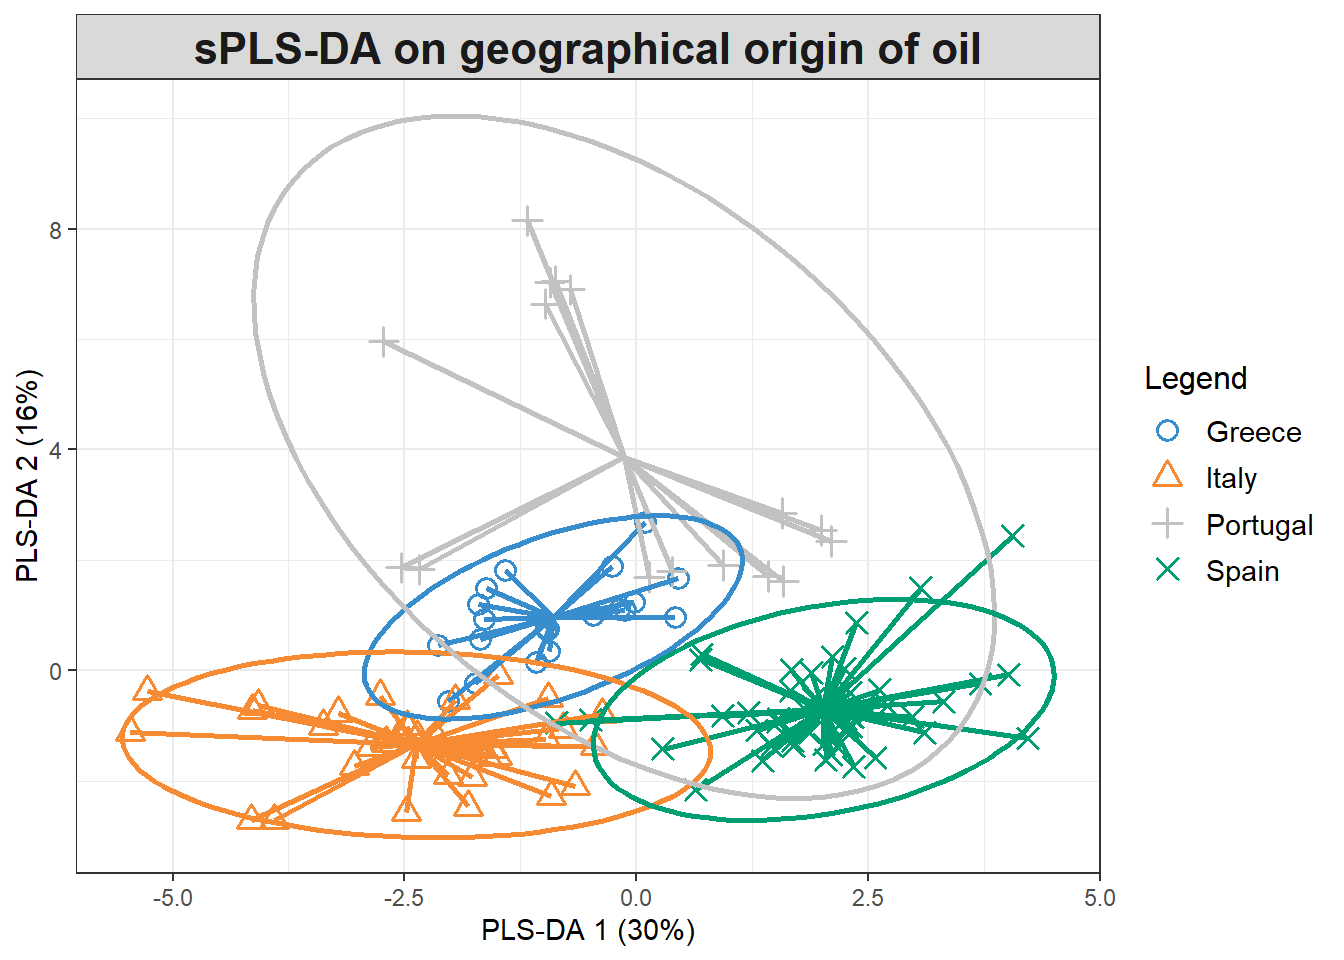
Discrimination accuracy based on traing and testing data
library(caret)
oildata <- cbind(Country, oil_data)

set.seed(100)

# Step 1: Get row numbers for the training data
trainRowNumbers <- createDataPartition(oildata$Country, p=0.7, list=FALSE)

# Step 2: Create the training  dataset
trainData <- oildata[trainRowNumbers,]

# Step 3: Create the test dataset
testData <- oildata[-trainRowNumbers,]

plsda_model <- caret::plsda(trainData[,2:571],factor(trainData$Country), ncomp = 6, probMethod = "Bayes")


C1 <- confusionMatrix(predict(plsda_model, trainData[,2:571]),as.factor(trainData$Country))

C2 <- confusionMatrix(predict(plsda_model, testData[,2:571]),as.factor(testData$Country))
The Confusion Matrix for geographical origin using training data
C1## Confusion Matrix and Statistics
##
## Reference
## Prediction Greece Italy Portugal Spain
## Greece 14 0 0 0
## Italy 0 24 0 3
## Portugal 0 0 12 0
## Spain 0 0 0 32
##
## Overall Statistics
##
## Accuracy : 0.9647
## 95% CI : (0.9003, 0.9927)
## No Information Rate : 0.4118
## P-Value [Acc > NIR] : < 2.2e-16
##
## Kappa : 0.9502
##
## Mcnemar's Test P-Value : NA
##
## Statistics by Class:
##
## Class: Greece Class: Italy Class: Portugal Class: Spain
## Sensitivity 1.0000 1.0000 1.0000 0.9143
## Specificity 1.0000 0.9508 1.0000 1.0000
## Pos Pred Value 1.0000 0.8889 1.0000 1.0000
## Neg Pred Value 1.0000 1.0000 1.0000 0.9434
## Prevalence 0.1647 0.2824 0.1412 0.4118
## Detection Rate 0.1647 0.2824 0.1412 0.3765
## Detection Prevalence 0.1647 0.3176 0.1412 0.3765
## Balanced Accuracy 1.0000 0.9754 1.0000 0.9571The Confusion Matrix for geographical origin using testing data
C2## Confusion Matrix and Statistics
##
## Reference
## Prediction Greece Italy Portugal Spain
## Greece 5 0 0 1
## Italy 0 10 0 0
## Portugal 0 0 4 1
## Spain 1 0 0 13
##
## Overall Statistics
##
## Accuracy : 0.9143
## 95% CI : (0.7694, 0.982)
## No Information Rate : 0.4286
## P-Value [Acc > NIR] : 2.195e-09
##
## Kappa : 0.8778
##
## Mcnemar's Test P-Value : NA
##
## Statistics by Class:
##
## Class: Greece Class: Italy Class: Portugal Class: Spain
## Sensitivity 0.8333 1.0000 1.0000 0.8667
## Specificity 0.9655 1.0000 0.9677 0.9500
## Pos Pred Value 0.8333 1.0000 0.8000 0.9286
## Neg Pred Value 0.9655 1.0000 1.0000 0.9048
## Prevalence 0.1714 0.2857 0.1143 0.4286
## Detection Rate 0.1429 0.2857 0.1143 0.3714
## Detection Prevalence 0.1714 0.2857 0.1429 0.4000
## Balanced Accuracy 0.8994 1.0000 0.9839 0.9083The overall accuracy for training set is 96% and for testing set is 91%.