Simple correlation analysis
2021-05-04
Correlation analysis
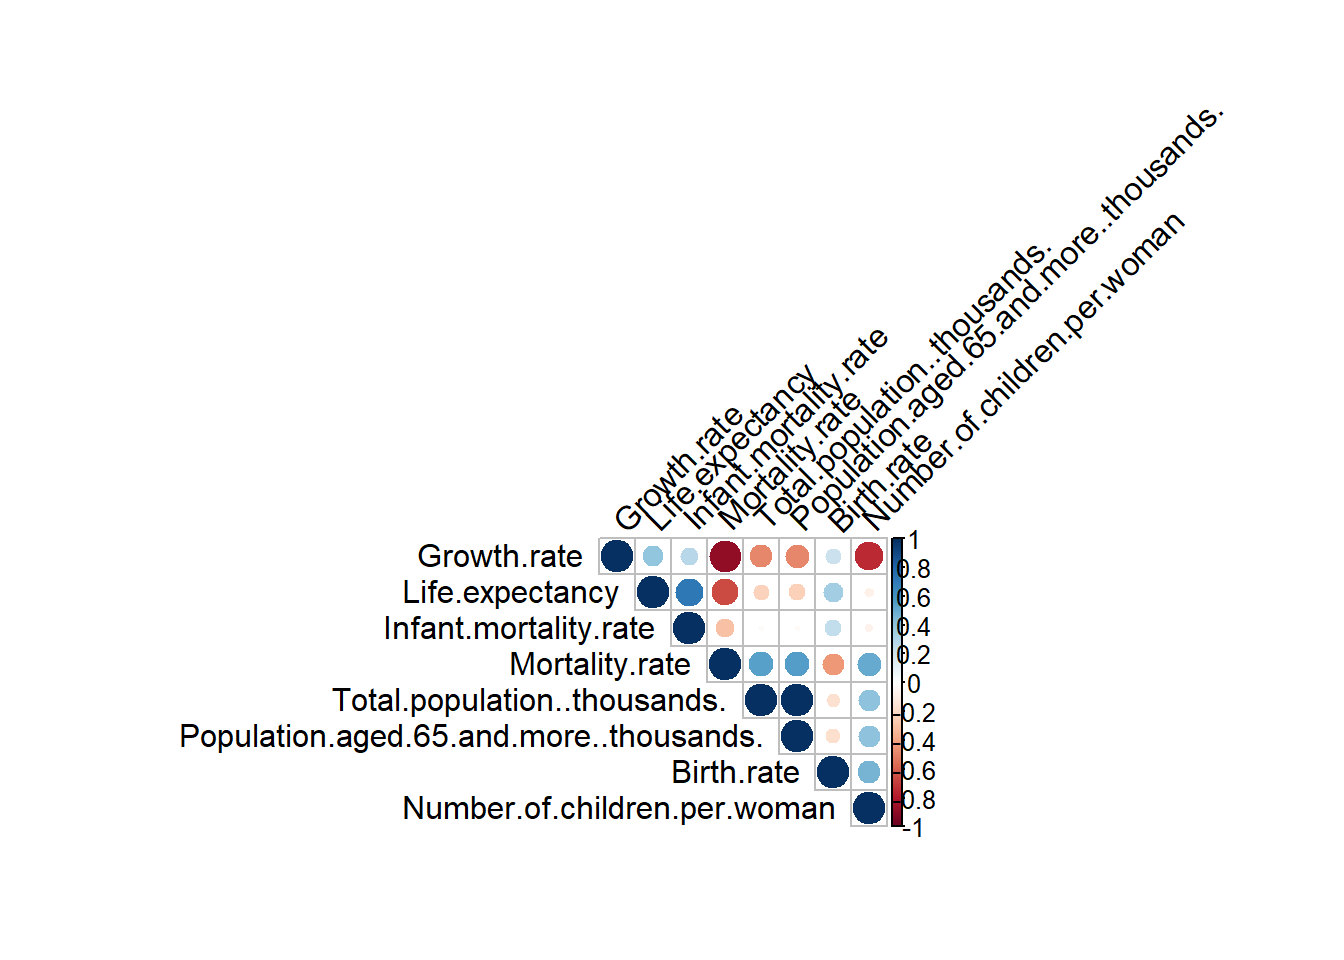
The correlation heatmap is quite helpful to show correlations between different variables such as contents of compositions.
The example of EU Population Prospects will be used for correlation analysis of Quality of life index.
Load data
setwd("C:/blog/Dataset")

data <- read.csv("eu.csv",header = T,stringsAsFactors = T )
dat <- data[,-1]
head(data)
## Countries Total.population..thousands. Birth.rate Mortality.rate
## 1 Austria 9043.070 9.999 9.972
## 2 Belgium 11632.300 10.659 9.775
## 3 France 65426.200 10.947 9.460
## 4 Germany 83900.500 9.464 11.570
## 5 Luxembourg 634.814 10.355 7.074
## 6 Netherlands 17173.100 10.119 9.043
## Life.expectancy Infant.mortality.rate Number.of.children.per.woman
## 1 81.813 2.578 1.562
## 2 81.942 2.482 1.719
## 3 82.916 2.773 1.841
## 4 81.634 2.471 1.614
## 5 82.556 2.556 1.417
## 6 82.567 2.201 1.667
## Growth.rate Population.aged.65.and.more..thousands.
## 1 3.34 1761.5
## 2 3.38 2276.9
## 3 2.38 13796.3
## 4 0.59 18438.9
## 5 12.93 93.0
## 6 2.23 3512.0Calculation significants and correlations coefficients
library(Hmisc)

res <- rcorr(as.matrix(dat))
# Extract the correlation coefficients

res$r
## Total.population..thousands. Birth.rate
## Total.population..thousands. 1.00000000 -0.1664787
## Birth.rate -0.16647866 1.0000000
## Mortality.rate 0.54201100 -0.4354210
## Life.expectancy -0.22762820 0.3436773
## Infant.mortality.rate -0.02444783 0.2414875
## Number.of.children.per.woman 0.40503563 0.4664838
## Growth.rate -0.48033379 0.2174427
## Population.aged.65.and.more..thousands. 0.99982299 -0.1785649
## Mortality.rate Life.expectancy
## Total.population..thousands. 0.5420110 -0.22762820
## Birth.rate -0.4354210 0.34367729
## Mortality.rate 1.0000000 -0.65121537
## Life.expectancy -0.6512154 1.00000000
## Infant.mortality.rate -0.2913914 0.71768987
## Number.of.children.per.woman 0.5007717 -0.07491628
## Growth.rate -0.8872834 0.39471555
## Population.aged.65.and.more..thousands. 0.5502695 -0.23449257
## Infant.mortality.rate
## Total.population..thousands. -0.02444783
## Birth.rate 0.24148750
## Mortality.rate -0.29139140
## Life.expectancy 0.71768987
## Infant.mortality.rate 1.00000000
## Number.of.children.per.woman -0.06790686
## Growth.rate 0.27830654
## Population.aged.65.and.more..thousands. -0.02806558
## Number.of.children.per.woman
## Total.population..thousands. 0.40503563
## Birth.rate 0.46648378
## Mortality.rate 0.50077173
## Life.expectancy -0.07491628
## Infant.mortality.rate -0.06790686
## Number.of.children.per.woman 1.00000000
## Growth.rate -0.74128367
## Population.aged.65.and.more..thousands. 0.40127427
## Growth.rate
## Total.population..thousands. -0.4803338
## Birth.rate 0.2174427
## Mortality.rate -0.8872834
## Life.expectancy 0.3947155
## Infant.mortality.rate 0.2783065
## Number.of.children.per.woman -0.7412837
## Growth.rate 1.0000000
## Population.aged.65.and.more..thousands. -0.4835130
## Population.aged.65.and.more..thousands.
## Total.population..thousands. 0.99982299
## Birth.rate -0.17856495
## Mortality.rate 0.55026954
## Life.expectancy -0.23449257
## Infant.mortality.rate -0.02806558
## Number.of.children.per.woman 0.40127427
## Growth.rate -0.48351304
## Population.aged.65.and.more..thousands. 1.00000000# Extract p-values
res$P## Total.population..thousands. Birth.rate
## Total.population..thousands. NA 0.6935720
## Birth.rate 6.935720e-01 NA
## Mortality.rate 1.652249e-01 0.2809065
## Life.expectancy 5.877110e-01 0.4045485
## Infant.mortality.rate 9.541786e-01 0.5645063
## Number.of.children.per.woman 3.195299e-01 0.2439472
## Growth.rate 2.283143e-01 0.6049639
## Population.aged.65.and.more..thousands. 1.386447e-11 0.6722397
## Mortality.rate Life.expectancy
## Total.population..thousands. 0.165224895 0.58771102
## Birth.rate 0.280906497 0.40454851
## Mortality.rate NA 0.08026243
## Life.expectancy 0.080262432 NA
## Infant.mortality.rate 0.483780501 0.04501218
## Number.of.children.per.woman 0.206218157 0.86005667
## Growth.rate 0.003284339 0.33318642
## Population.aged.65.and.more..thousands. 0.157599816 0.57617804
## Infant.mortality.rate
## Total.population..thousands. 0.95417858
## Birth.rate 0.56450626
## Mortality.rate 0.48378050
## Life.expectancy 0.04501218
## Infant.mortality.rate NA
## Number.of.children.per.woman 0.87306551
## Growth.rate 0.50449426
## Population.aged.65.and.more..thousands. 0.94740466
## Number.of.children.per.woman
## Total.population..thousands. 0.31952989
## Birth.rate 0.24394715
## Mortality.rate 0.20621816
## Life.expectancy 0.86005667
## Infant.mortality.rate 0.87306551
## Number.of.children.per.woman NA
## Growth.rate 0.03532671
## Population.aged.65.and.more..thousands. 0.32447618
## Growth.rate
## Total.population..thousands. 0.228314326
## Birth.rate 0.604963872
## Mortality.rate 0.003284339
## Life.expectancy 0.333186421
## Infant.mortality.rate 0.504494257
## Number.of.children.per.woman 0.035326712
## Growth.rate NA
## Population.aged.65.and.more..thousands. 0.224800623
## Population.aged.65.and.more..thousands.
## Total.population..thousands. 1.386447e-11
## Birth.rate 6.722397e-01
## Mortality.rate 1.575998e-01
## Life.expectancy 5.761780e-01
## Infant.mortality.rate 9.474047e-01
## Number.of.children.per.woman 3.244762e-01
## Growth.rate 2.248006e-01
## Population.aged.65.and.more..thousands. NA