PCA plots using different pre-treatments
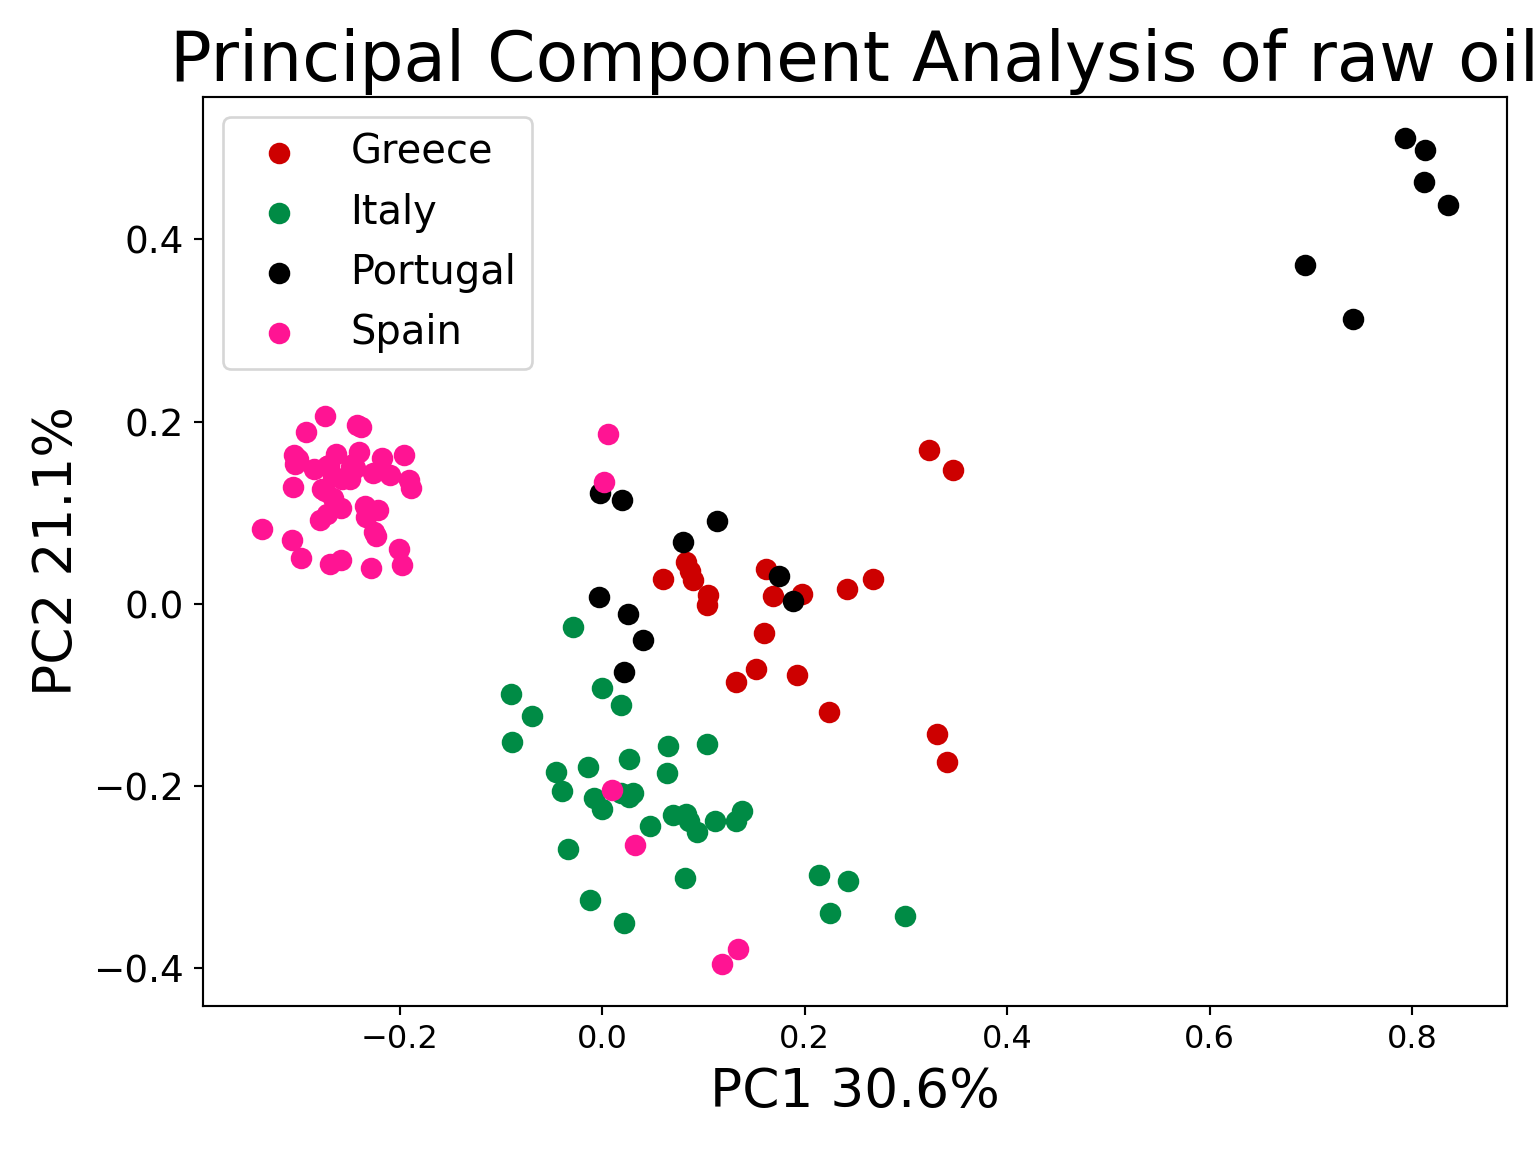
PCA plots with raw data
pca_oil_raw = PCA(n_components=3)
principalComponents_oil = pca_oil_raw.fit_transform(oil)

principal_oil_Df = pd.DataFrame(data = principalComponents_oil, columns = ['principal component 1','principal component 2', 'principal component 3'])

principal_oil_Df.tail()
##      principal component 1  principal component 2  principal component 3
## 115              -0.296913               0.050949              -0.111565
## 116               0.118397              -0.395352               0.041215
## 117               0.133961              -0.378638               0.053863
## 118               0.009523              -0.204413               0.054615
## 119               0.032706              -0.263974               0.034556
print('Explained variation per principal component: {}'.format(pca_oil_raw.explained_variance_ratio_))
## Explained variation per principal component: [0.46126247 0.25206043 0.05789436]
plt.figure()
plt.figure(figsize=(8,6))
plt.xticks(fontsize=12)
## (array([0. , 0.2, 0.4, 0.6, 0.8, 1. ]), [Text(0.0, 0, '0.0'), Text(0.2, 0, '0.2'), Text(0.4, 0, '0.4'), Text(0.6000000000000001, 0, '0.6'), Text(0.8, 0, '0.8'), Text(1.0, 0, '1.0')])
plt.yticks(fontsize=14)
## (array([0. , 0.2, 0.4, 0.6, 0.8, 1. ]), [Text(0, 0.0, '0.0'), Text(0, 0.2, '0.2'), Text(0, 0.4, '0.4'), Text(0, 0.6000000000000001, '0.6'), Text(0, 0.8, '0.8'), Text(0, 1.0, '1.0')])
plt.xlabel('PC1 30.6%',fontsize=20)
plt.ylabel('PC2 21.1%',fontsize=20)
plt.title("Principal Component Analysis of raw oil",fontsize=26)

targets = ["Greece","Italy","Portugal", "Spain"]
colors = ["#CD0000", "#008B45", "#000000", "#FF1493"]
for target, color in zip(targets,colors):
    indicesToKeep = oil_data['Countries'] == target
    plt.scatter(principal_oil_Df.loc[indicesToKeep, 'principal component 1']
               , principal_oil_Df.loc[indicesToKeep, 'principal component 2'], c = color, s = 50)

plt.legend(targets,prop={'size': 15})
plt.tight_layout()
plt.show()

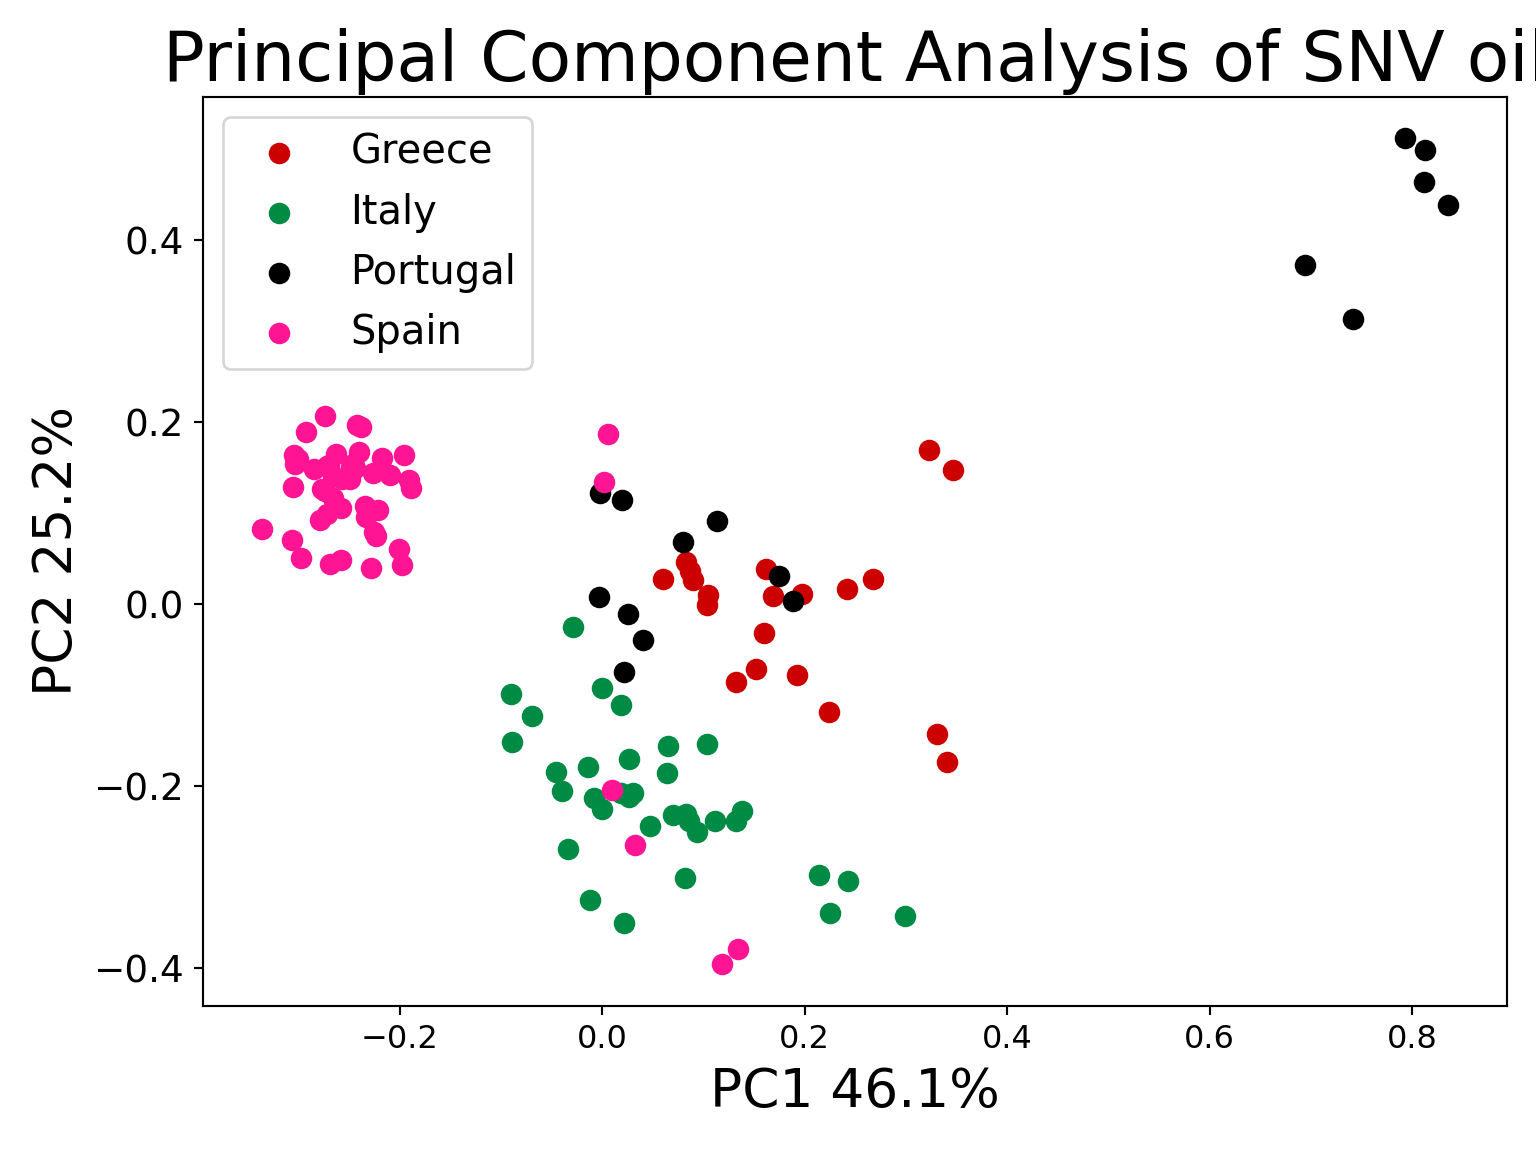
PCA plots with SNV data
pca_oil_snv = PCA(n_components=3)
principalComponents_oil_snv = pca_oil_snv.fit_transform(oil_snv)

principal_oil_Df = pd.DataFrame(data = principalComponents_oil_snv, columns = ['principal component 1','principal component 2', 'principal component 3'])

principal_oil_Df.tail()
##      principal component 1  principal component 2  principal component 3
## 115              -0.296916               0.050949              -0.111566
## 116               0.118399              -0.395355               0.041214
## 117               0.133963              -0.378641               0.053862
## 118               0.009524              -0.204415               0.054616
## 119               0.032707              -0.263976               0.034556
print('Explained variation per principal component: {}'.format(pca_oil_snv.explained_variance_ratio_))
## Explained variation per principal component: [0.46126252 0.25206018 0.05789437]
plt.figure()
plt.figure(figsize=(8,6))
plt.xticks(fontsize=12)
## (array([0. , 0.2, 0.4, 0.6, 0.8, 1. ]), [Text(0.0, 0, '0.0'), Text(0.2, 0, '0.2'), Text(0.4, 0, '0.4'), Text(0.6000000000000001, 0, '0.6'), Text(0.8, 0, '0.8'), Text(1.0, 0, '1.0')])
plt.yticks(fontsize=14)
## (array([0. , 0.2, 0.4, 0.6, 0.8, 1. ]), [Text(0, 0.0, '0.0'), Text(0, 0.2, '0.2'), Text(0, 0.4, '0.4'), Text(0, 0.6000000000000001, '0.6'), Text(0, 0.8, '0.8'), Text(0, 1.0, '1.0')])
plt.xlabel('PC1 46.1%',fontsize=20)
plt.ylabel('PC2 25.2%',fontsize=20)
plt.title("Principal Component Analysis of SNV oil",fontsize=26)

targets = ["Greece","Italy","Portugal", "Spain"]
colors = ["#CD0000", "#008B45", "#000000", "#FF1493"]
for target, color in zip(targets,colors):
    indicesToKeep = oil_data['Countries'] == target
    plt.scatter(principal_oil_Df.loc[indicesToKeep, 'principal component 1']
               , principal_oil_Df.loc[indicesToKeep, 'principal component 2'], c = color, s = 50)

plt.legend(targets,prop={'size': 15})
plt.tight_layout()
plt.show()

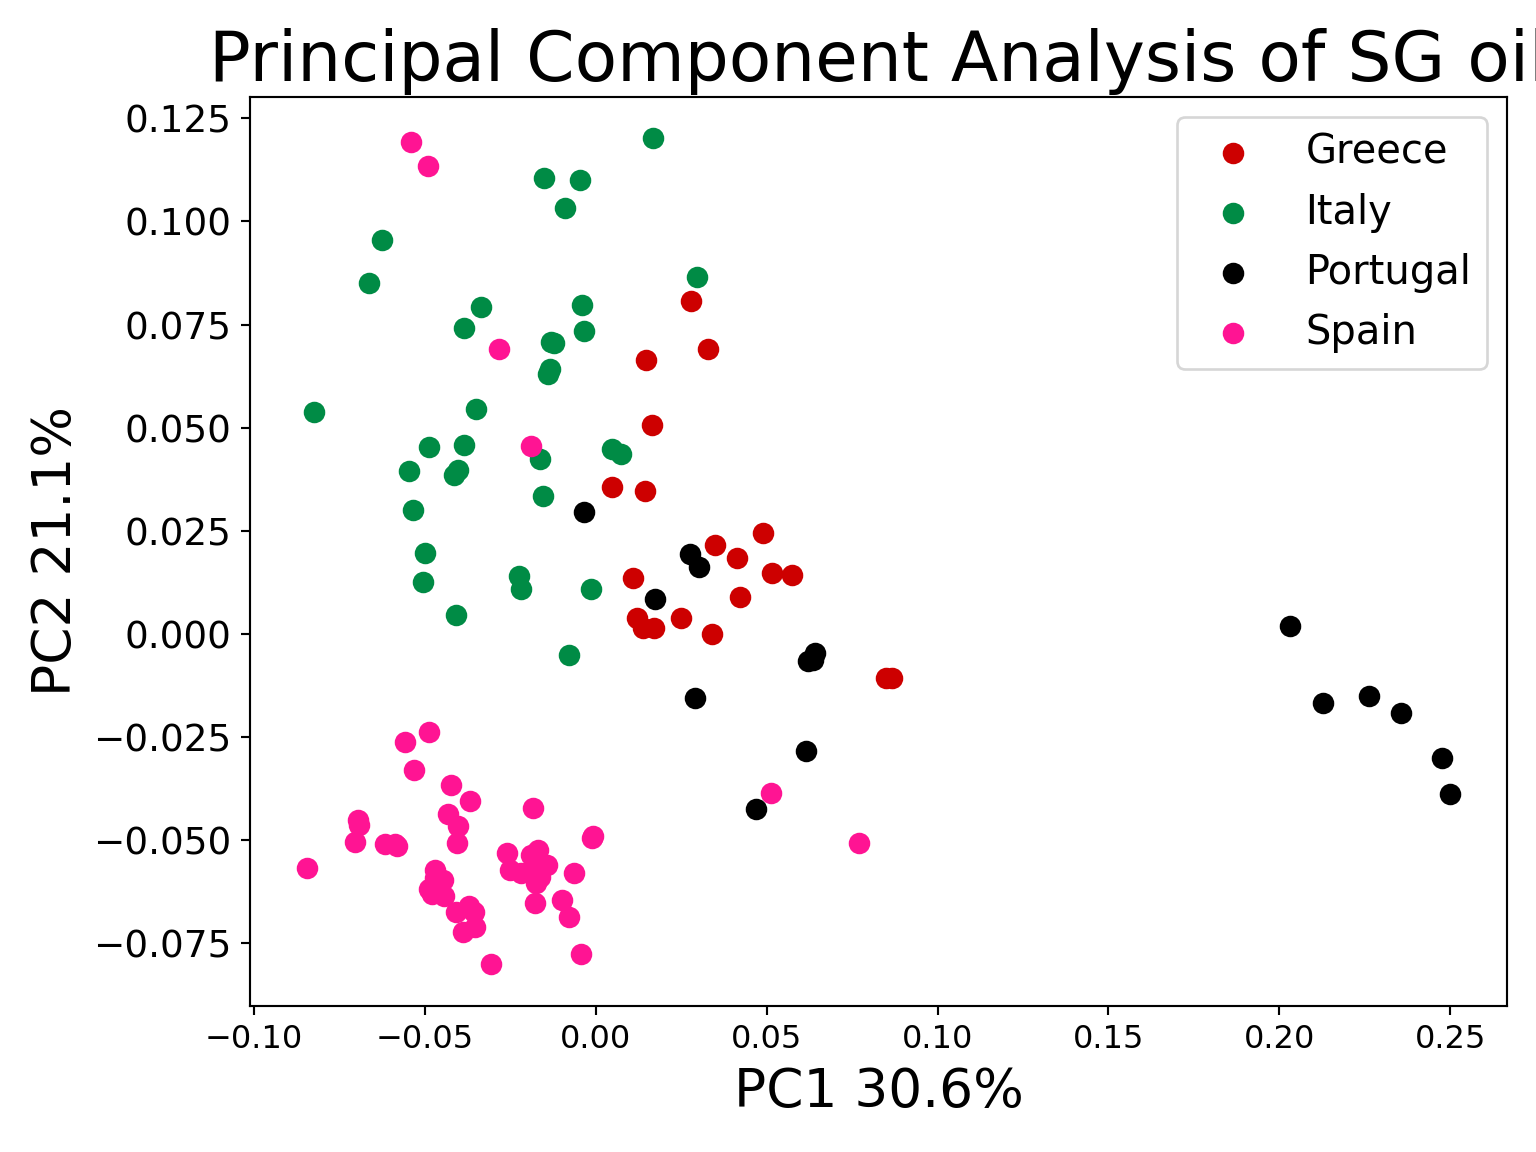
PCA plots with SG data
pca_oil = PCA(n_components=3)
principalComponents_oil_sg = pca_oil.fit_transform(oil_sg)

principal_oil_Df = pd.DataFrame(data = principalComponents_oil_sg, columns = ['principal component 1','principal component 2', 'principal component 3'])

principal_oil_Df.tail()
##      principal component 1  principal component 2  principal component 3
## 115              -0.069488              -0.045126               0.023853
## 116              -0.054010               0.119382              -0.013546
## 117              -0.048952               0.113395              -0.023043
## 118              -0.018831               0.045615              -0.044294
## 119              -0.028277               0.068972              -0.001258
print('Explained variation per principal component: {}'.format(pca_oil.explained_variance_ratio_))
## Explained variation per principal component: [0.30679875 0.21167453 0.08481524]
plt.figure()
plt.figure(figsize=(8,6))
plt.xticks(fontsize=12)
## (array([0. , 0.2, 0.4, 0.6, 0.8, 1. ]), [Text(0.0, 0, '0.0'), Text(0.2, 0, '0.2'), Text(0.4, 0, '0.4'), Text(0.6000000000000001, 0, '0.6'), Text(0.8, 0, '0.8'), Text(1.0, 0, '1.0')])
plt.yticks(fontsize=14)
## (array([0. , 0.2, 0.4, 0.6, 0.8, 1. ]), [Text(0, 0.0, '0.0'), Text(0, 0.2, '0.2'), Text(0, 0.4, '0.4'), Text(0, 0.6000000000000001, '0.6'), Text(0, 0.8, '0.8'), Text(0, 1.0, '1.0')])
plt.xlabel('PC1 30.6%',fontsize=20)
plt.ylabel('PC2 21.1%',fontsize=20)
plt.title("Principal Component Analysis of SG oil",fontsize=26)

targets = ["Greece","Italy","Portugal", "Spain"]
colors = ["#CD0000", "#008B45", "#000000", "#FF1493"]
for target, color in zip(targets,colors):
    indicesToKeep = oil_data['Countries'] == target
    plt.scatter(principal_oil_Df.loc[indicesToKeep, 'principal component 1']
               , principal_oil_Df.loc[indicesToKeep, 'principal component 2'], c = color, s = 50)

plt.legend(targets,prop={'size': 15})
plt.tight_layout()
plt.show()


